Predicting performance of a power plant with linear regression
by Elias Hernandis • Published Feb. 18, 2023 • Tagged applications, machine learning, statistics
This post is about a project I did a few years back when I was formally learning about linear regression for the first time during my Mathematics degree.
I'm no expert on electrical engineering and energy generation although it has always fascinated me how essentially all power generation, except for solar photovoltaic, is generated by spinning a turbine to drive a generator which in turn delivers electricity directly to the grid. Even then, apart from wind and hydro (and maybe some other obscure methods), all forms of generation burn some kind of fuel to heat water which makes that turbine spin.
This common factor (the turbine-generator idea) has been studied, modeled and optimized to literally its fullest extent. I'm way out of my normal area of expertise (and therefore probably getting stuff massively wrong) but apparently Physics says transforming heat to work is called a Carnot cycle and it turns out it has an upper efficiency limit. Modern thermal power plants use a combination of two Carnot cycles to essentially achieve1 this upper efficiency limit of about 65%.

There are, however, several environmental factors like ambient pressure or humidity that can influence the efficiency at which a power plant can operate. Even if it's for just a couple percentage points, it makes economic sense to turn off these plants when the conditions are not just right.2
I got some data from the Machine Learning Repository at UC Irvine which consists of measurements of four ambient variables together with electrical power output when a combined cycle power plant was operating at full capacity. The data itself comes from a study by Pinar Tüfekci in 2014. I decided to perform a simple linear regression to try to estimate the influence of each of these variables on the overall electrical power output. The explanatory variables are:
- AP: Ambient pressure (in millibars)
- V: Vacuum pressure3 (in mmHg)
- T: Ambient temperature (Celsius degrees)
- RH: Relative humidity (dimensionless)
We have around 9000 data points which relate these variables to a single response variable, net power output.
Anyways we run the model which basically means finding the coefficients which minimize the squared error between the real value of electrical power output and the value predicted by this equation:
We get the following values for the coefficients that accompany each of them
| bias | AP | V | T | RH | |
|---|---|---|---|---|---|
| Estimated value | 455.07 | 0.06 | -0.23 | -1.94 | -0.14 |
Around 92% of variance is explained by the model so we can consider this to be a good-enough estimate ().
From those values we can deduce that vacuum pressure, temperature and relative humidity are negatively correlated with electrical power output, while ambient pressure is positively correlated. Beware that we cannot conclude that temperature has the biggest effect or that ambient pressure has the smallest, since the data are in wildly different units. I also did proper hypothesis testing to evaluate some toy assumptions I made by looking at the Carnot cycle, but I'll save them for another post.
We only trained the model on around 4000 data points. Now, we draw 50 more at random to compare the estimate given by the model to the real observed power output. I knew nothing about train-test model evaluation at the time so I just thought of comparing them qualitatively by looking at a chart.
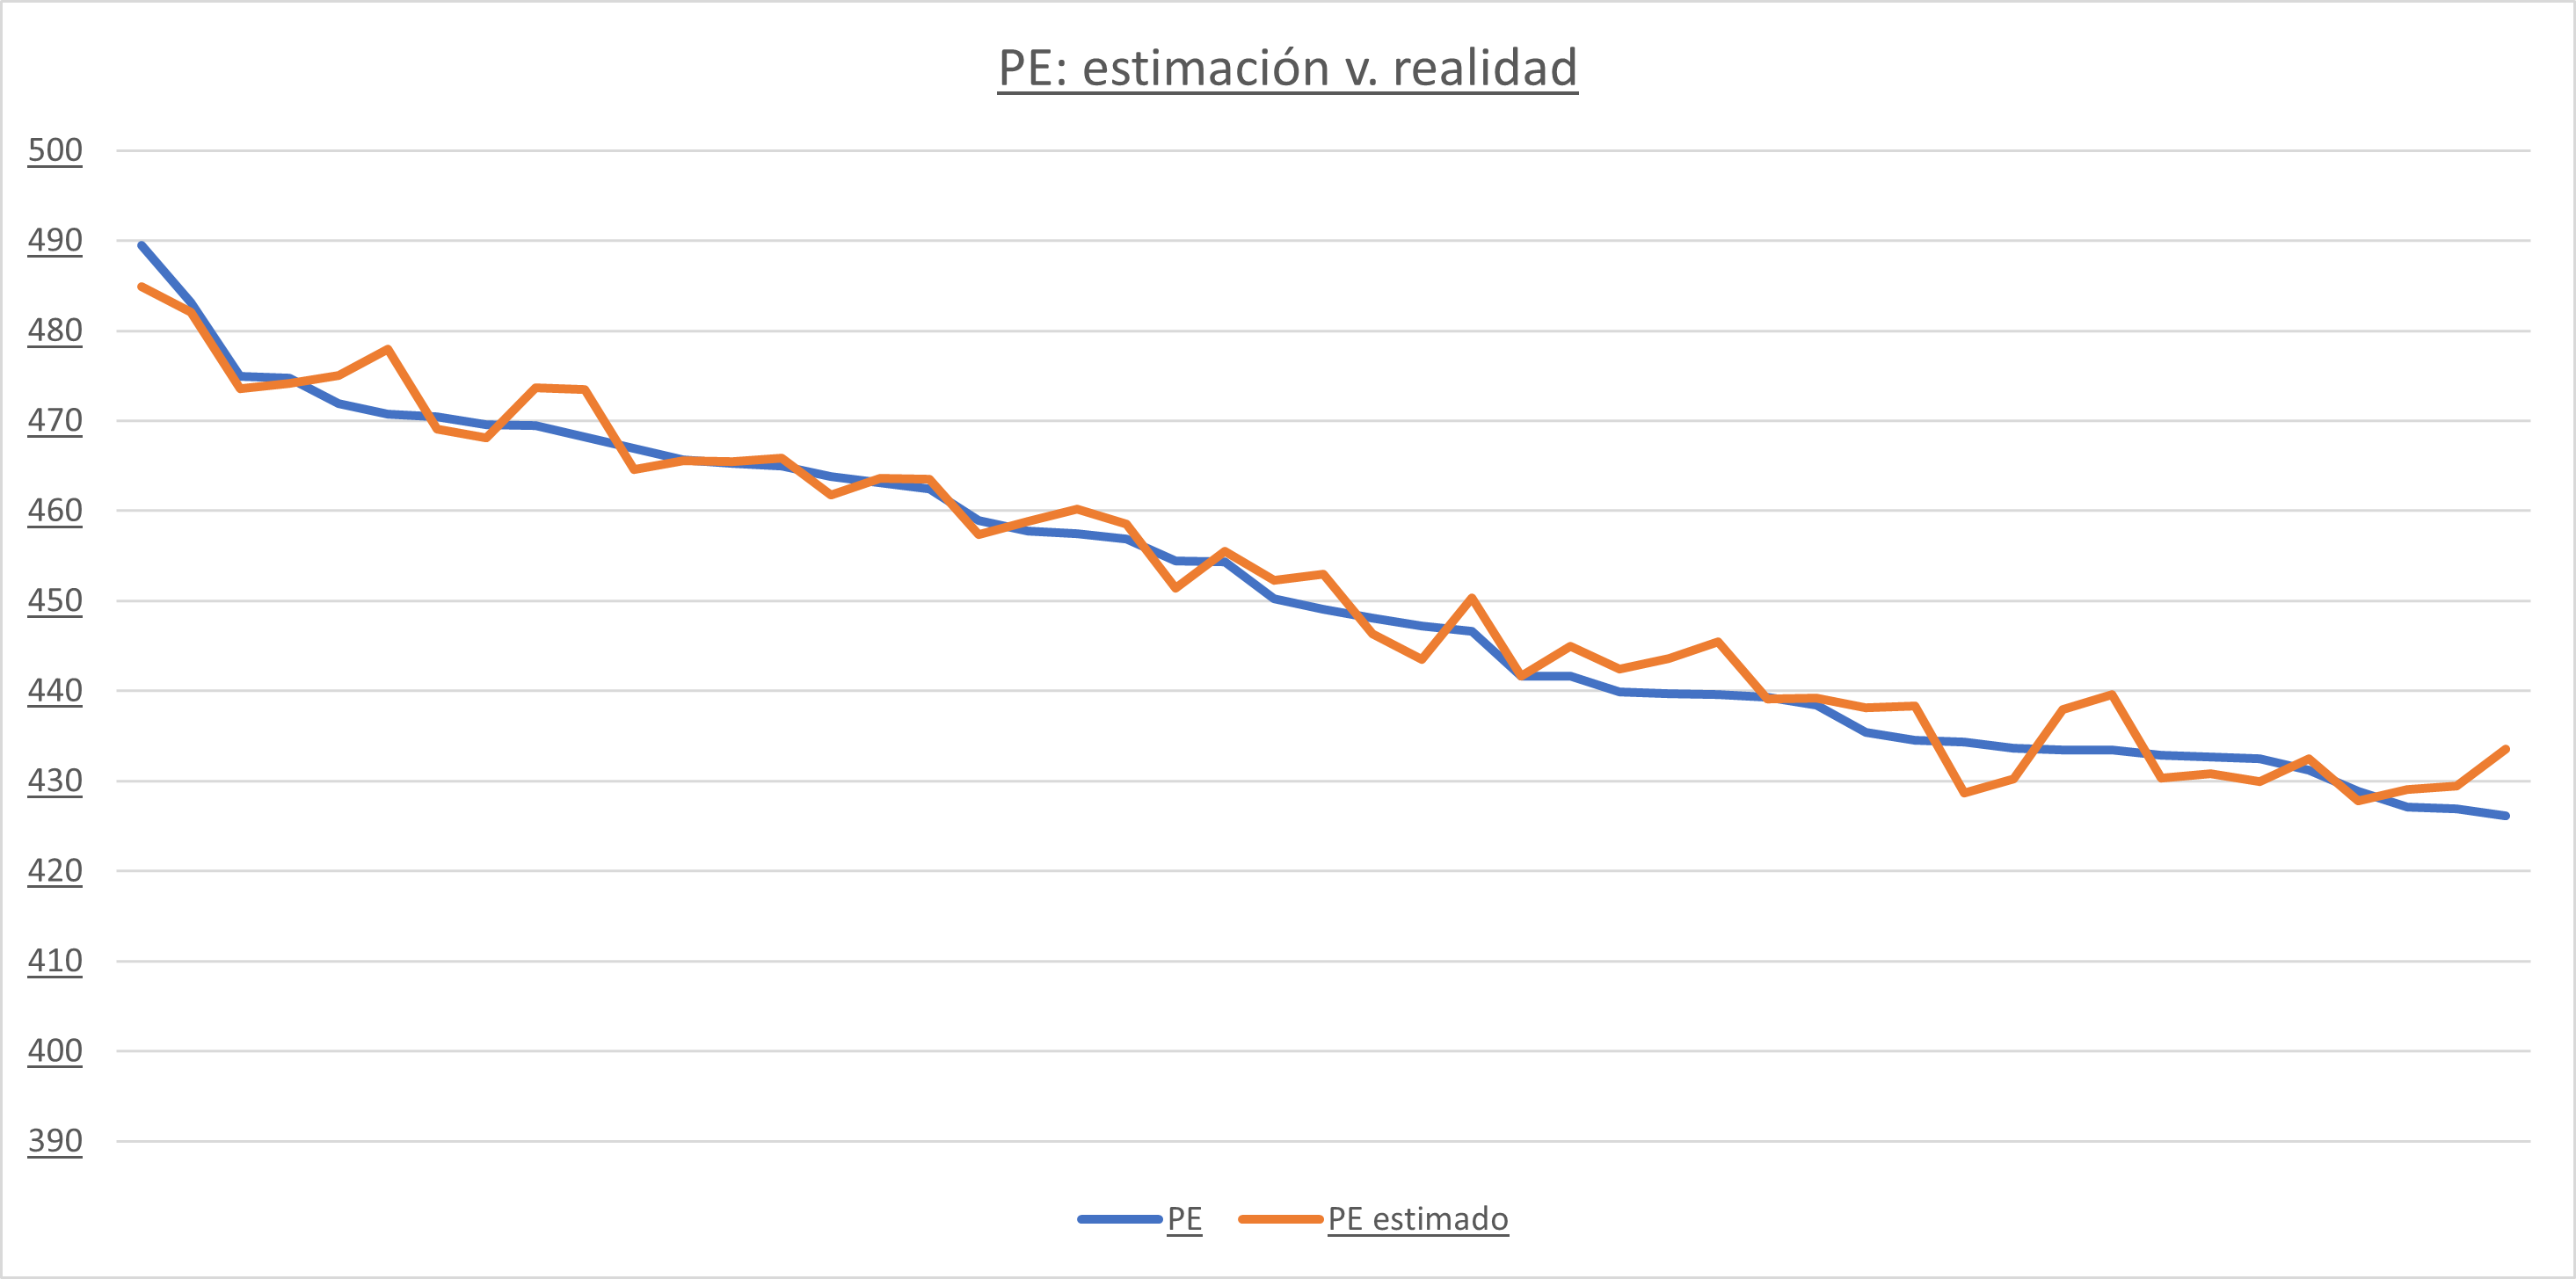
I really don't know if the results are good or bad, especially in comparison with other techniques that may be used for predicting power output in electric power plants but I remember spending dozens of hours reading about how the electrical grid works while researching for this project and I really did have a good time.
That's all!
-
The Carnot theorem says that for two given temperatures for the hot and cold parts of the system, there is an upper efficiency limit. There is indeed some work going on to make turbine blades more heat-resistant to increase efficiency, but as far as I know, we're essentially operating power plants very close to this efficiency limit for the temperatures they work with. ↩
-
Combined-cycle power plants typically start as peak-load generators that run only when there's no other way to get enough electrical supply to the grid, but their increased efficiency makes them suitable to continue to provide power and be more like base load plants. Since they're very expensive to operate because natural gas ain't cheap, deciding if a started plant should remain active and provide base load power is a decision that's not taken lightly. ↩
-
I've no idea what vacuum pressure is but I think it's the pressure at the exhaust of the gas turbine. ↩