Effect of random errors when selecting top candidates with a panel of experts
by Elias Hernandis • Published Jan. 18, 2024 • Tagged maths, simulations, python
This weekend I was talking to someone on the board of a scientific association which organizes a biyearly congress. Like in many other congresses, attendees are encouraged to submit abstracts for evaluation by a panel of experts, who select the top proposals for oral presentations and posters.
The review process so far has been a two-step process that looked something like this:
- Each judge reviews all abstracts individually and puts forward a proposal with the top N abstracts they liked the most.
- The panel meets and discusses all abstracts nominated by at least one judge and come up with a final list of abstracts that would get presented or displayed as posters.
The panel is made up of nine experts, and, under the current system, every judge would review each abstract multiple times. However, the congress has been steadily growing to the point where they now get around 1000 submissions per edition.
The reason everyone reviews every abstract is because they want to ensure fairness, but I was wondering how things would look like if we applied some form of system where each judge only had to review a fraction of the total abstracts, at least for the first round. I'm sure many such systems have been proposed and analyzed formally, but I wanted to run a couple of simple simulations inspired by how RAID stores data to get a sense of how much time would be saved and how different the results would be compared to the original system.
Evaluating the everyone-reviews-everything system
Before proposing strategies where each abstract is reviewed only by a subset of the panel, I wanted to check how the inherent errors and biases that judges will make when evaluating each abstract affect the number of abstracts that would move on to the second round.
To be able to carry out our simulations we'll make a few assumptions:
- Each abstract has a an underlying true score that is unknown to everybody. We'll assume these scores are normally distributed.
- Judges are imperfect but they get close enough to that theoretical score. More specifically, when a judge evaluates an abstract, they report a score which is the underlying true score plus a random, normally distributed error with 0 mean.
- Judges report the top 20% of abstracts they've scored for further examination by the panel as a whole.
We want to get a feel of how this method works, particularly in terms of many out of all abstracts are considered for the second round under this method.
I did a quick simulation with 9 judges which evaluated all abstracts on a scale of 0 to 100. Each judge basically returns a score that is the underlying score plus a random error. Here's the chart we got:
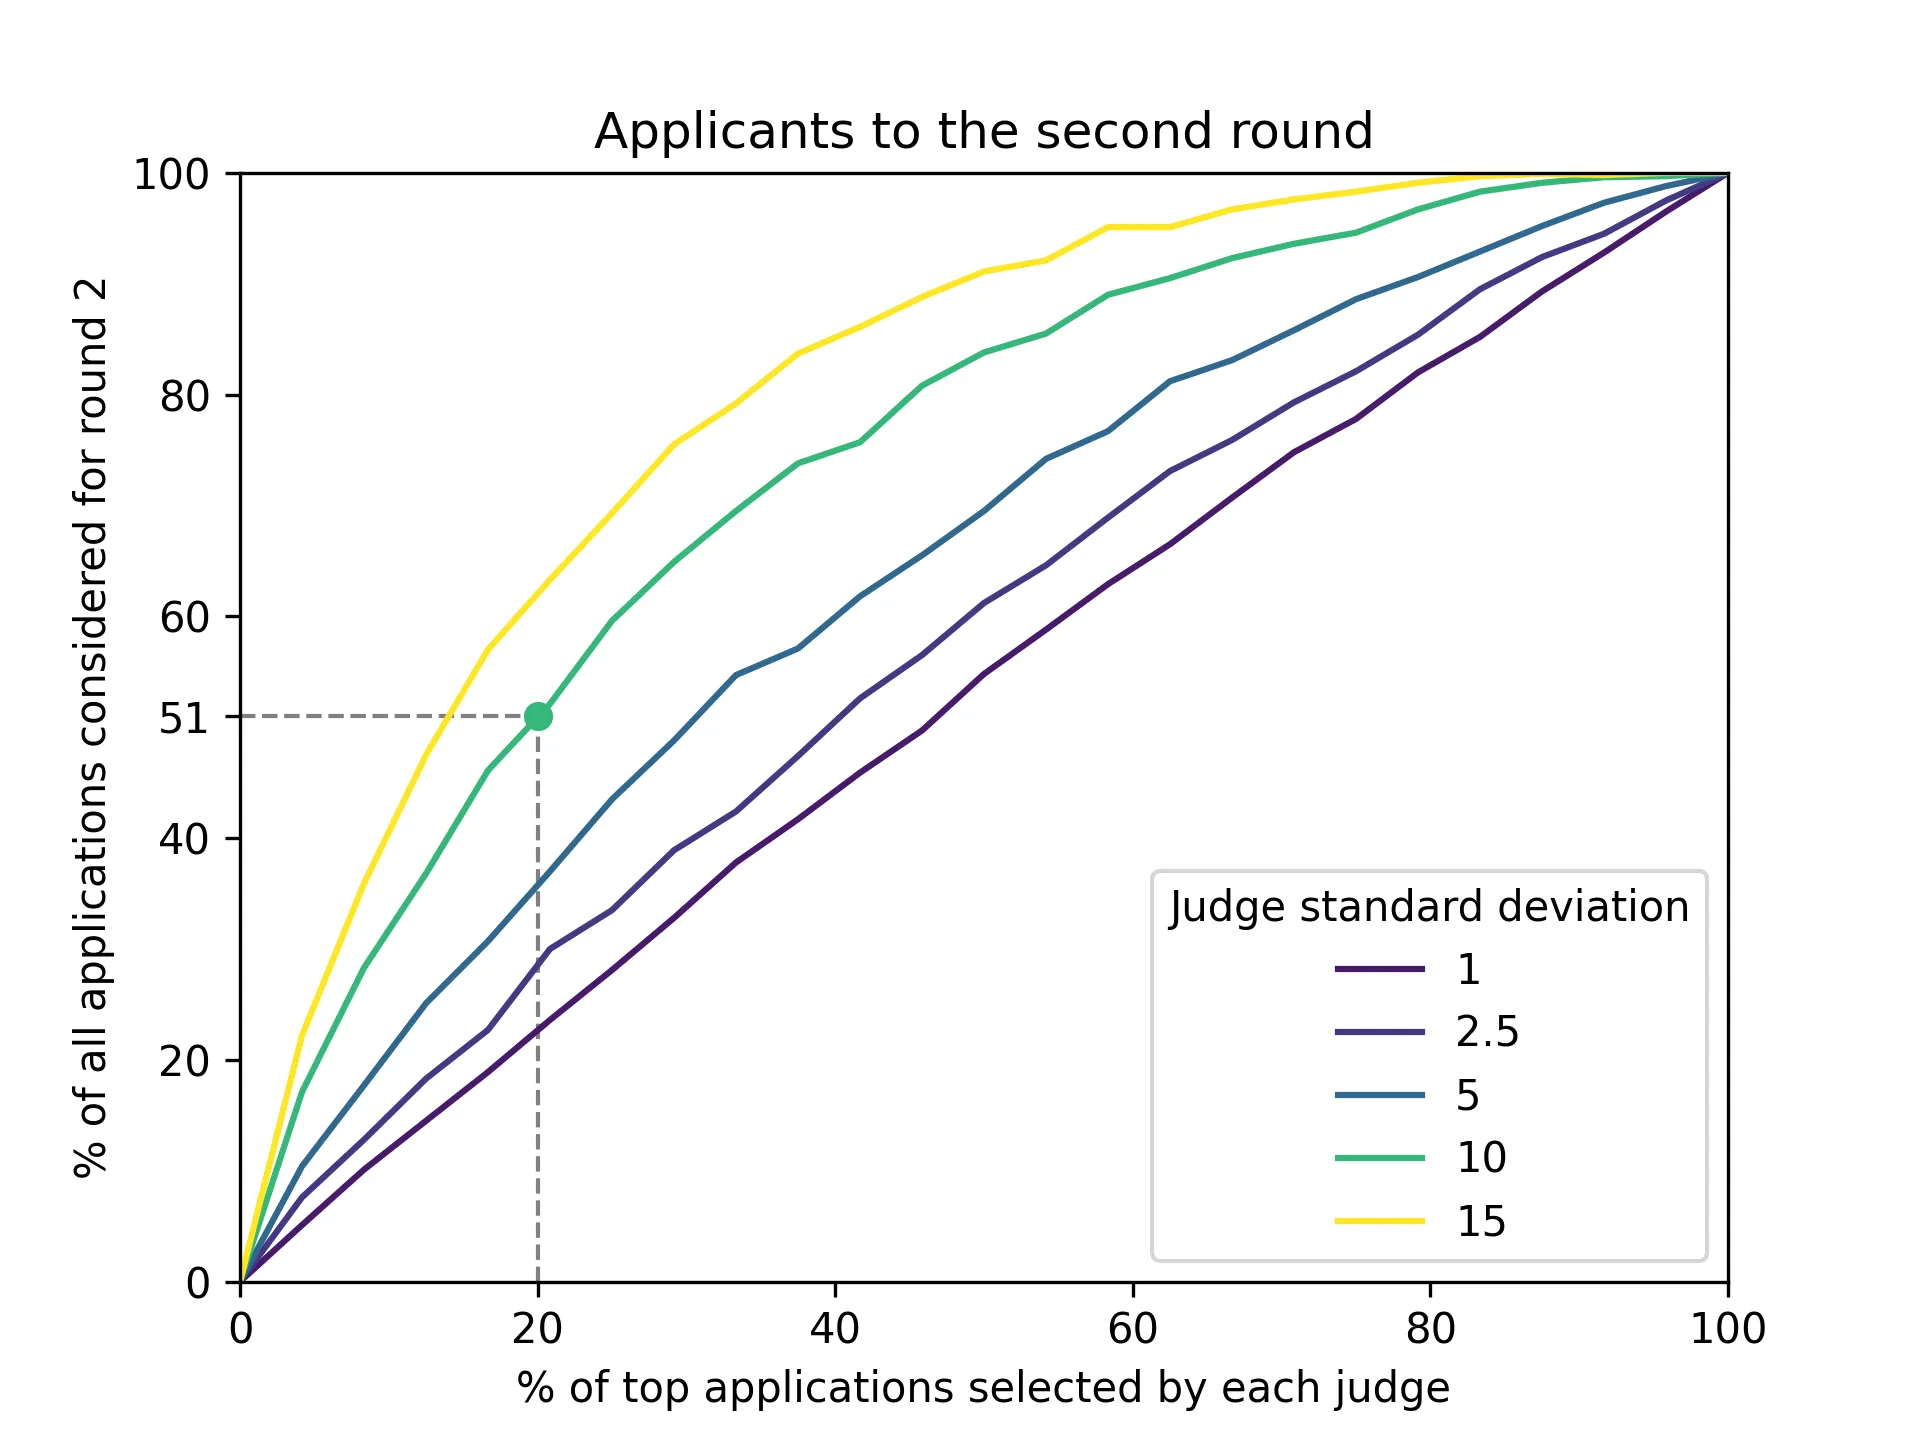
Let's discuss the green line which shows judges which make a random error with standard deviation set to 10 points. Since the error is normally distributed, we know that 68% of the values drawn will be within one standard deviation of the mean. This translates to our judges evaluating abstracts with a score that is within 10 points of the true underlying score for 68% of cases, which seems like a reasonable estimate (but feel free to look at another line if you think it's too much or too little).
The main conclusion we can draw from the simulation is that if we ask each expert to select the top 20% of abstracts to be considered for the next round, and they make an error with a standard deviation of 10 points, we can expect to have to review 51% of all submissions on the second round.
Here's the full code I used for the simulation:
import numpy as np
import matplotlib.pyplot as plt
from itertools import chain

np.random.seed(1729)

n_abstracts = 1000
n_judges = 9

# generate the true underlying scores for all abstracts
true_scores = np.random.normal(loc=50, scale=14, size=n_abstracts)


def single_judge_evaluation(true_scores, top_percent=0.2, stddev=10):
    """
    Returns the top % of abstracts according to a judge.
    """
    n_top = int(true_scores.size * top_percent)
    if n_top == 0:
        return []

    biased_scores = true_scores + np.random.normal(
        loc=0, scale=stddev, size=true_scores.size
    )
    sorted_indices = np.argsort(biased_scores)
    return sorted_indices[-n_top:]


def combine_evaluations(judge_selections):
    """
    Combines a list of lists of top abstracts and returns the set of all
    abstracts which appear at least once in any list.
    """
    return set(chain(*judge_selections))


fig, ax = plt.subplots()
for stddev in [1, 2.5, 5, 10, 15]:

    top_n_percents = np.linspace(0, 1, 25)
    combined_size = np.array([len(combine_evaluations(
                    [single_judge_evaluation(true_scores, top_percent=x, stddev=stddev) for _ in range(n_judges)]
                )) / n_abstracts for x in top_n_percents])
    ax.plot(
        top_n_percents * 100,
        combined_size * 100,
        label=str(stddev),
        color=plt.cm.viridis(stddev / 15)
    )

ax.set_title('Applicants to the second round')
ax.set_xlabel('% of top applications selected by each judge')
ax.set_ylabel('% of all applications considered for round 2')
ax.set_ylim(0, 100)
ax.set_xlim(0, 100)
ax.legend().set_title('Judge standard deviation')

# Highlight a point
highlight_x, highlight_y = 20, 51
ax.scatter(highlight_x, highlight_y, color=plt.cm.viridis(10/15), marker='o', zorder=10)
plt.plot([highlight_x, highlight_x], [0, highlight_y], color='gray', linestyle='--', linewidth=1, label='Vertical Line', zorder=1)
plt.plot([0, highlight_x], [highlight_y, highlight_y], color='gray', linestyle='--', linewidth=1, label='Horizontal Line', zorder=1)
plt.yticks(np.append(plt.yticks()[0], highlight_y))

plt.savefig('/Users/elias/Documents/brain/assets/202401/imperfect-judges.webp', dpi=300)
To be honest I spent way too much time playing with the chart, that's probably why I didn't have time to simulate other strategies but now we have an excuse for another post!